Top 10 Web Design Trends to Watch for in 2023
Web Design trends are continuously evolving, adapting to new technologies, user behaviours and cultural shits. In 2023 there are several exciting web design..
Website KPIs, or key performance indicators, are a crucial aspect of measuring the success and effectiveness of a website. These website metrics allow businesses to track and analyse their website’s performance, identify areas of improvement, and make informed decisions about their online presence.

There are many tools and platforms available to help businesses track and analyze their website KPIs. These include Google Analytics, which provides key metrics for website performance, and specific tools such as Hotjar, which allows businesses to track visitor behaviour and identify areas for improvement. There are many different website KPIs that businesses can track, depending on their goals and objectives. Some common examples include:
Website Traffic KPI (Key Performance Indicator) is a metric that measures the number of visitors to a website over a given period of time or site traffice. It is an important metric to track because it helps businesses to understand the performance of their website in terms of attracting visitors and generating interest.
There are several ways to calculate website traffic KPI, including using tools like Google Analytics. These tools can provide detailed information about the sources of traffic, such as search engines, social media, or referral websites.
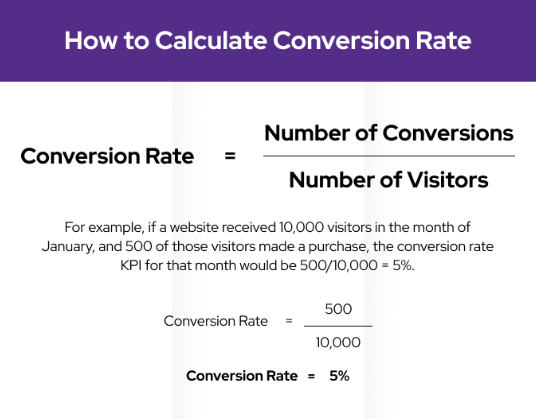
Conversion rate KPI (Key Performance Indicator) is a metric that measures the percentage of website visitors who take a desired action, such as making a purchase, filling out a form, or signing up for a newsletter. It is an important metric to track because it helps businesses to understand how well their website is able to convert visitors into customers or leads.
To calculate conversion rate KPI, you can use the following formula:
Conversion Rate KPI = Number of Conversions / Number of Visitors
For example, if a website received 10,000 visitors in the month of January, and 500 of those visitors made a purchase, the conversion rate KPI for that month would be 500/10,000 = 5%.
It is important to note that website conversion rate KPI can vary widely depending on the specific goals of the website and the nature of the desired action. For example, a website that is focused on generating leads may have a lower conversion rate than a website that is focused on generating sales, as it may be easier to get a visitor to fill out a form than to make a purchase.
Tracking website conversion rate KPI can be useful for identifying opportunities for improving the effectiveness of a website in converting visitors into customers or leads. It can also be useful for comparing the performance of different marketing channels or campaigns, as well as for identifying patterns or trends over time.
It is important to note that a high bounce rate is not necessarily a negative indicator. For example, a website with a high bounce rate may still be successful at achieving its goals if the desired action (such as making a purchase or filling out a form) can be completed on the first page. On the other hand, a website with a low bounce rate may indicate that visitors are engaging with the content and spending more time on the website.
Tracking bounce rate can be useful for identifying opportunities for improving the effectiveness of a website in engaging and retaining visitors. It can also be useful for comparing the performance of different pages or sections of a website, as well as for identifying patterns or trends over time.
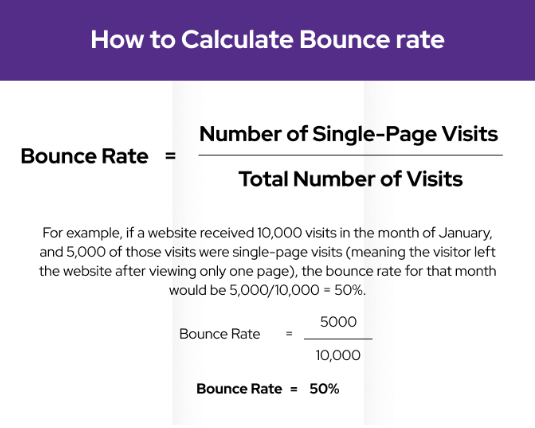
Bounce rate is a website KPI that measures the percentage of visitors who leave a website after viewing only one page. It is an important metric to track because it can provide insights into the effectiveness of a website in engaging and retaining visitors.
To calculate bounce rate, you can use the following formula:
Bounce Rate = Number of Single-Page Visits / Total Number of Visits
For example, if a website received 10,000 visits in the month of January, and 5,000 of those visits were single-page visits (meaning the visitor left the website after viewing only one page), the bounce rate for that month would be 5,000/10,000 = 50%.
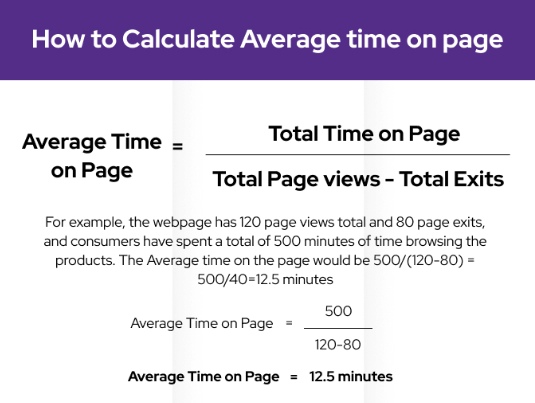
Average time on page is a website KPI that measures the amount of time that visitors spend on a particular page of a website. It is an important metric to track because it can provide insights into the effectiveness of a website in engaging and retaining visitors.
Average Time on Page is calculated as the total time on page, divided by the total number of pageviews minus the number of exits
It is important to note that average time on a page can vary widely depending on the content and purpose of the page. For example, a page with longer-form content (such as an article or blog post) may have a higher average time on page than a page with shorter content (such as a product page).
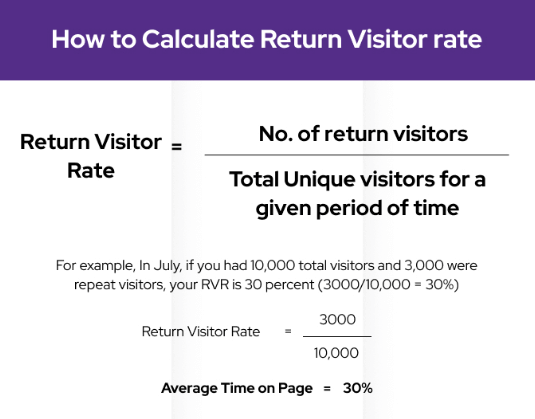
Return visitor rate is a website KPI that measures the percentage of visitors who return to a website after their initial visit. It is an important metric to track because it can provide insights into the effectiveness of a website in engaging and retaining visitors.
As a general guideline, a return visitor rate of 30% or higher may be considered strong, while a rate below 20% may indicate that there is room for improvement in terms of engaging and retaining visitors. However, it is important to keep in mind that the ideal return visitor rate will depend on the specific circumstances of the website and its audience.
Maintaining a roughly even split between new and returning visitors (such as a 50-50% split) can also be a positive indicator, as it can suggest that the website is effectively attracting new visitors while also retaining a significant portion of its existing audience.
In conclusion, web analytics is a critical tool for understanding the performance of a website and for identifying opportunities for improvement. By tracking a website’s key performance indicators (Website KPIs) such as traffic, conversion rate, bounce rate, average time on page, and return visitor rate, businesses can gain valuable insights into the effectiveness of their website in attracting and engaging visitors, as well as its overall performance in achieving business goals.
Overall, web analytics is an essential component of website performance measurement, and it is important for businesses to regularly track and analyze relevant KPIs in order to optimize their website’s effectiveness and achieve their goals.
Sign up for our monthly newsletter.
We will understand your business and brainstorm some ideas to tackle your problem.
Turn your website into a lead generation machine using our strategies.
Web Design trends are continuously evolving, adapting to new technologies, user behaviours and cultural shits. In 2023 there are several exciting web design..
As the online marketplace becomes increasingly competitive, having a website is no longer enough to stand out. To create a successful online presence, businesses must also focus on creating a strong brand identity. In this blog post, we’ll explore how website design and branding work together to help businesses achieve their goals.
A web strategy is a plan that describes the measures a company should take to attain its online goals and objectives. It is a road map that guides the development and implementation of a company’s digital presence, which includes its website, social media, and other online platforms.
Web Design trends are continuously evolving, adapting to new technologies, user behaviours and cultural shits. In 2023 there are several exciting web design..
As the online marketplace becomes increasingly competitive, having a website is no longer enough to stand out. To create a successful online presence, businesses must also focus on creating a strong brand identity. In this blog post, we’ll explore how website design and branding work together to help businesses achieve their goals.